
EnVista · Monitor
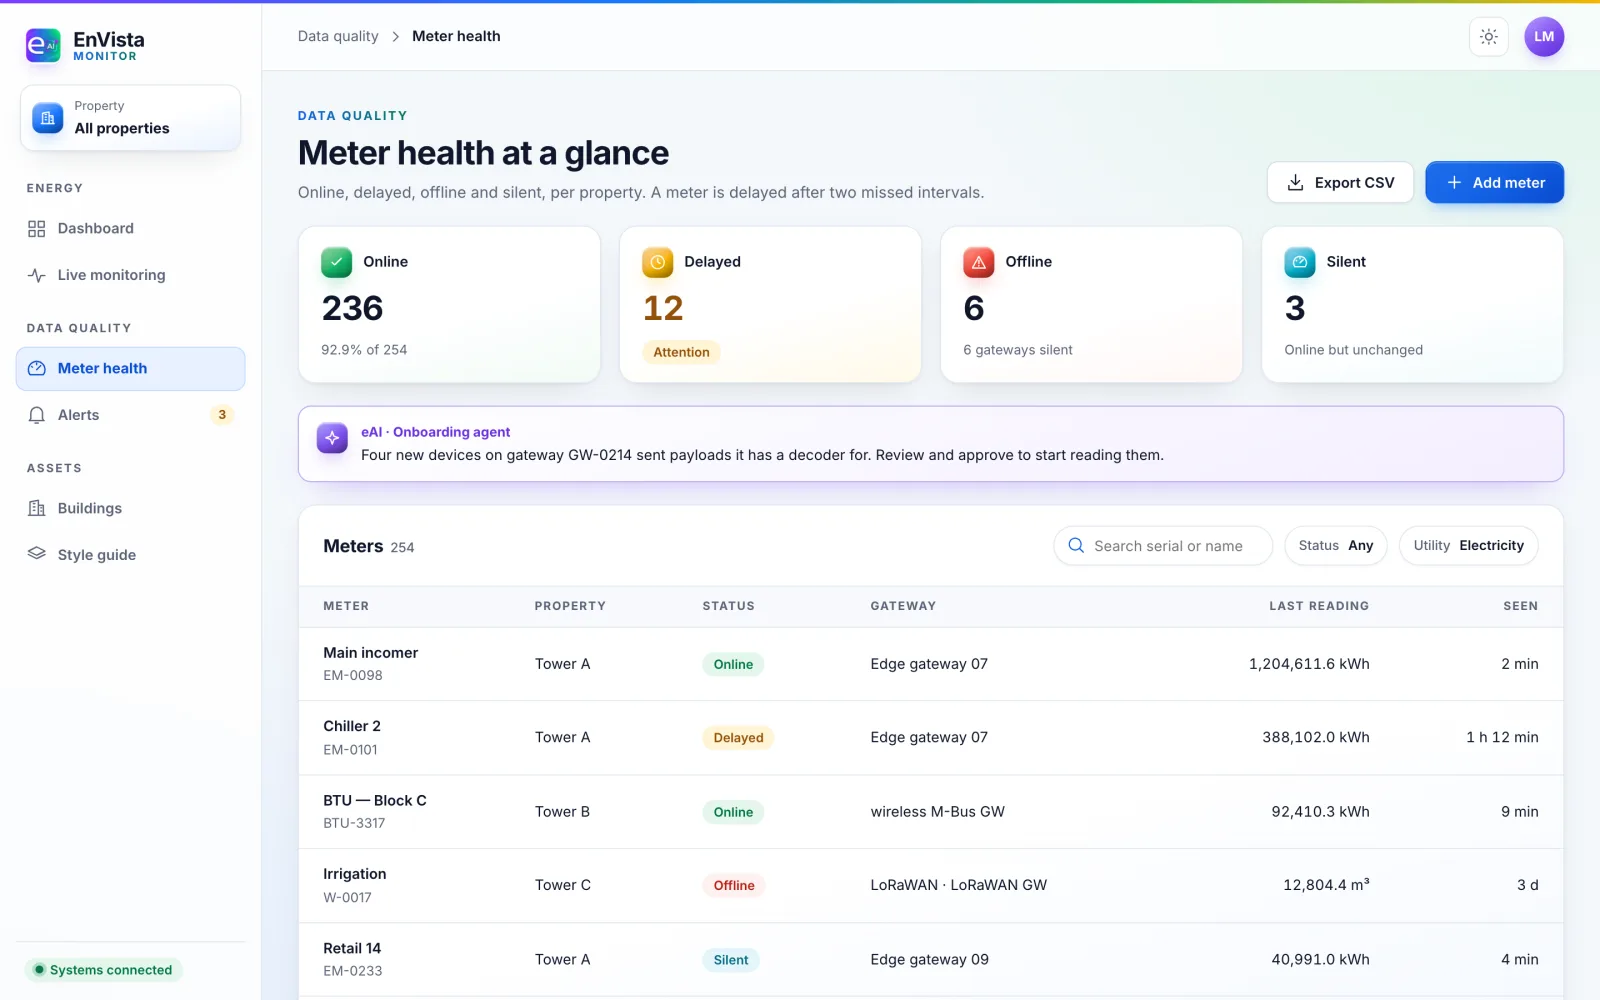
Shows problems the hour they start
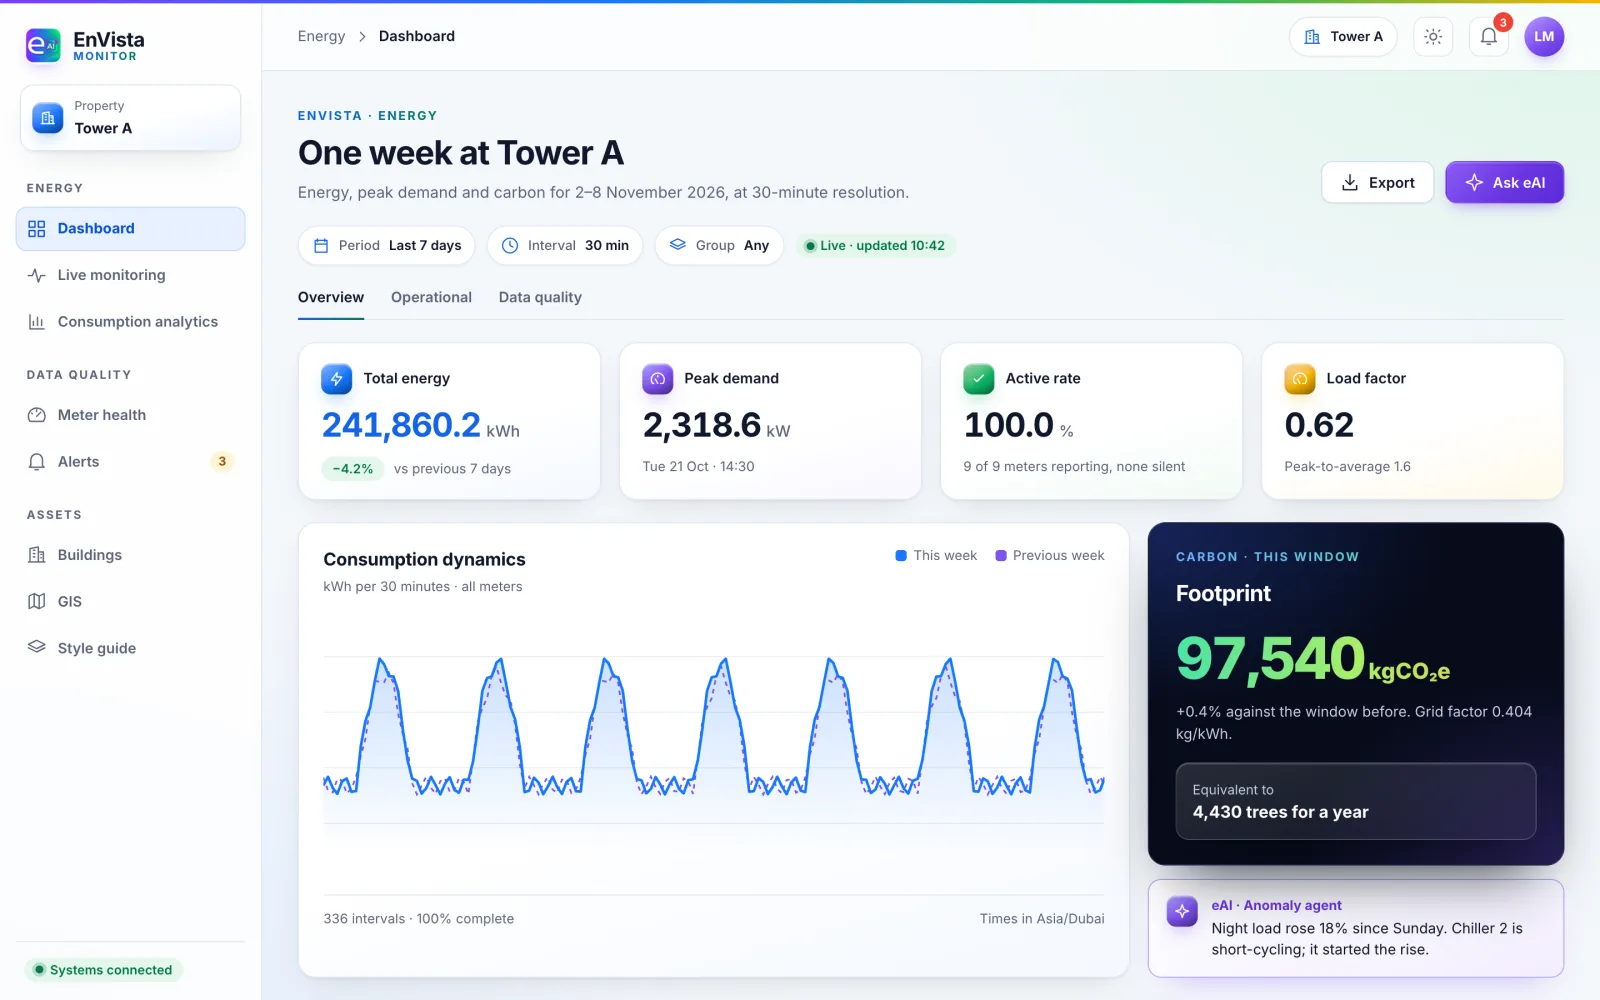
EnVista is where your team works day to day: live energy and water dashboards, alerts that mean something, analytics and reports. In the browser, or on the desktop with EnDesk.
What it does
Energy and water, one place to run them
Energy dashboard
Energy, peak demand and carbon at any resolution, for one building or the whole portfolio.
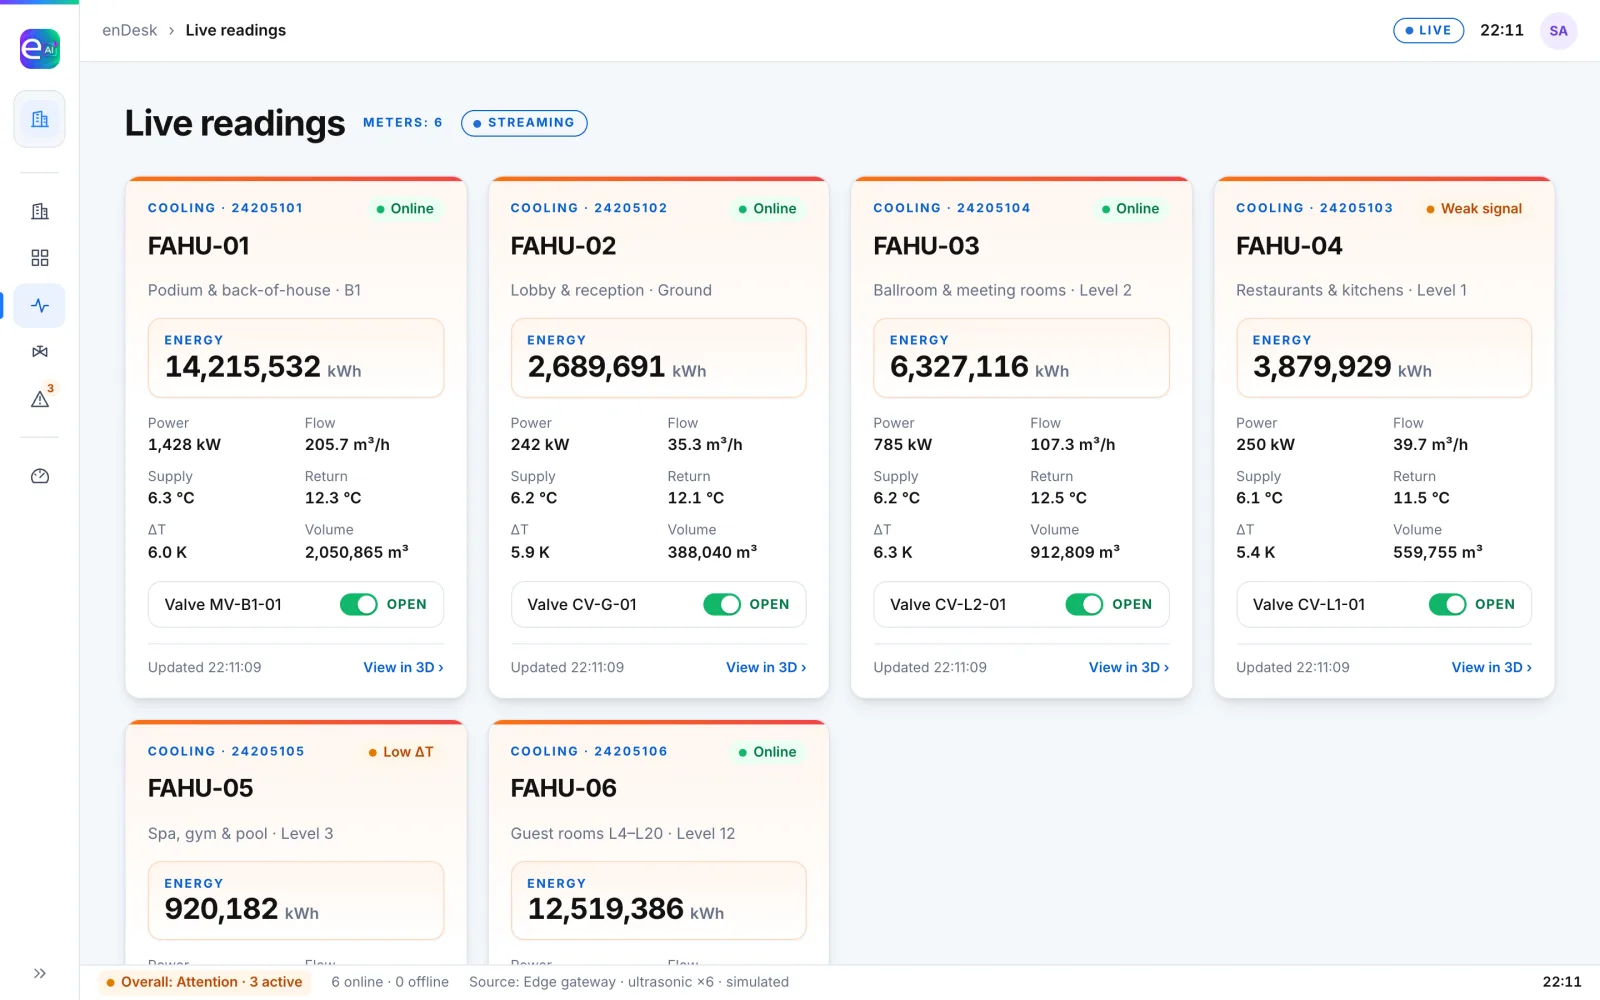
Live monitoring
Values stream in and show how old they are, so nobody acts on a stale reading.
Alerts that mean something
One alert per problem, per meter, with daily digests instead of alarm floods.
Analytics and reports
Load factor, benchmarking per m², and PDF or Excel reports on a schedule.
Anomaly agent
Explains a spike in plain language with its cost, then raises one alert for the real problem.
EnDesk
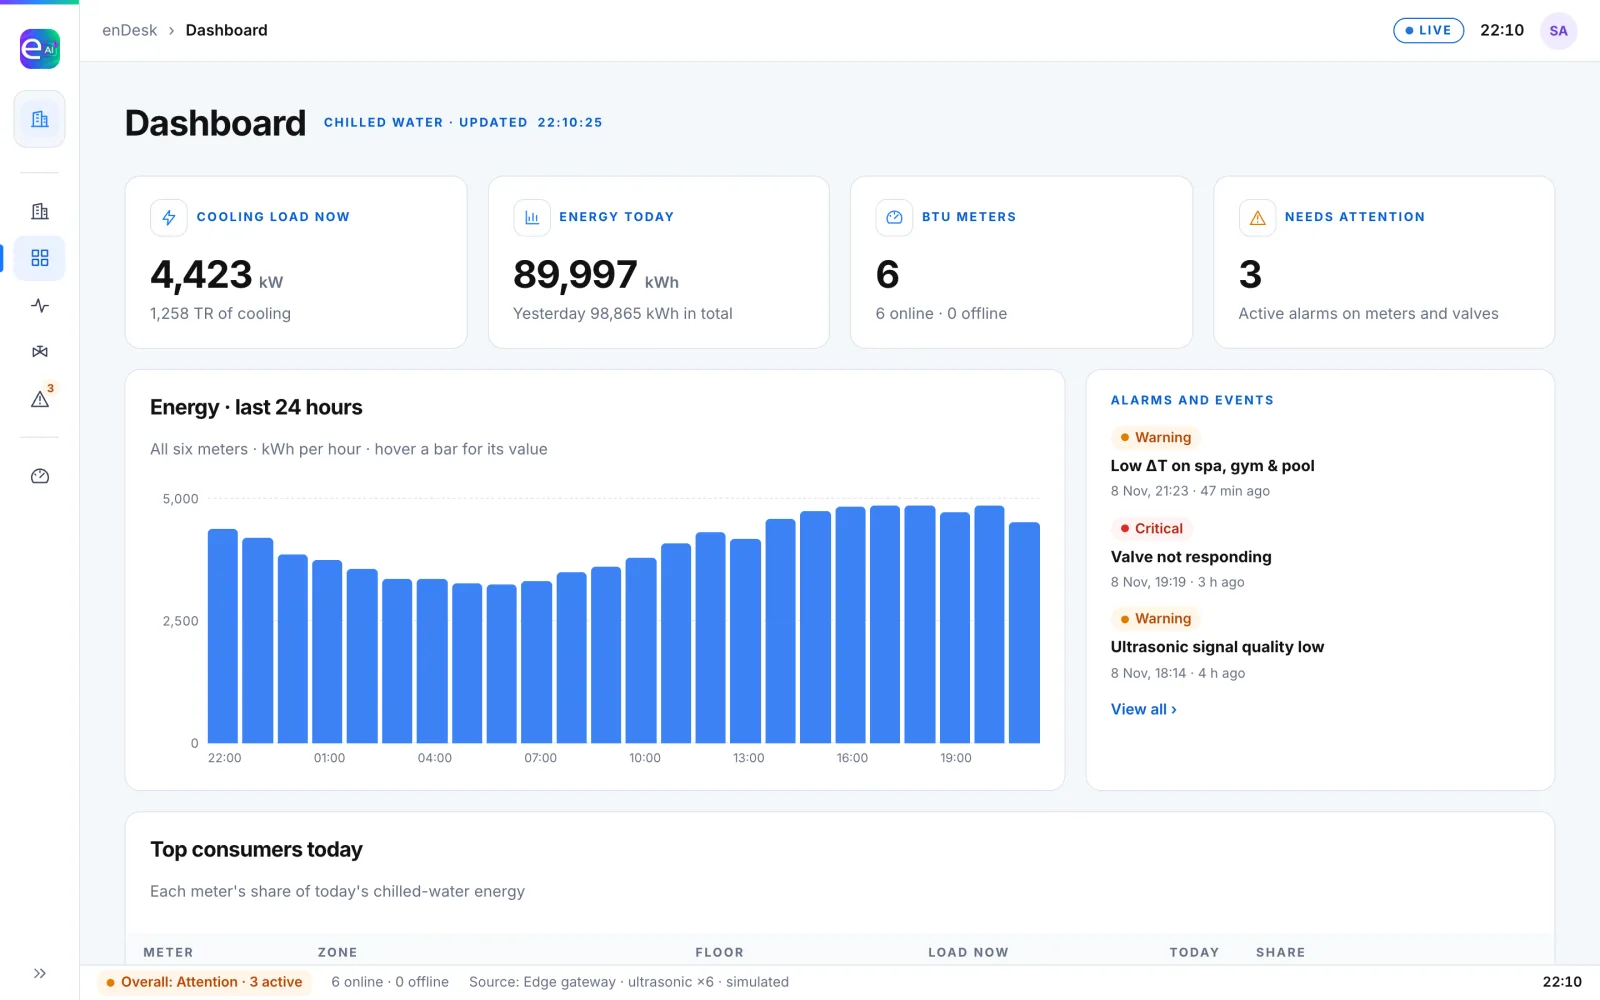
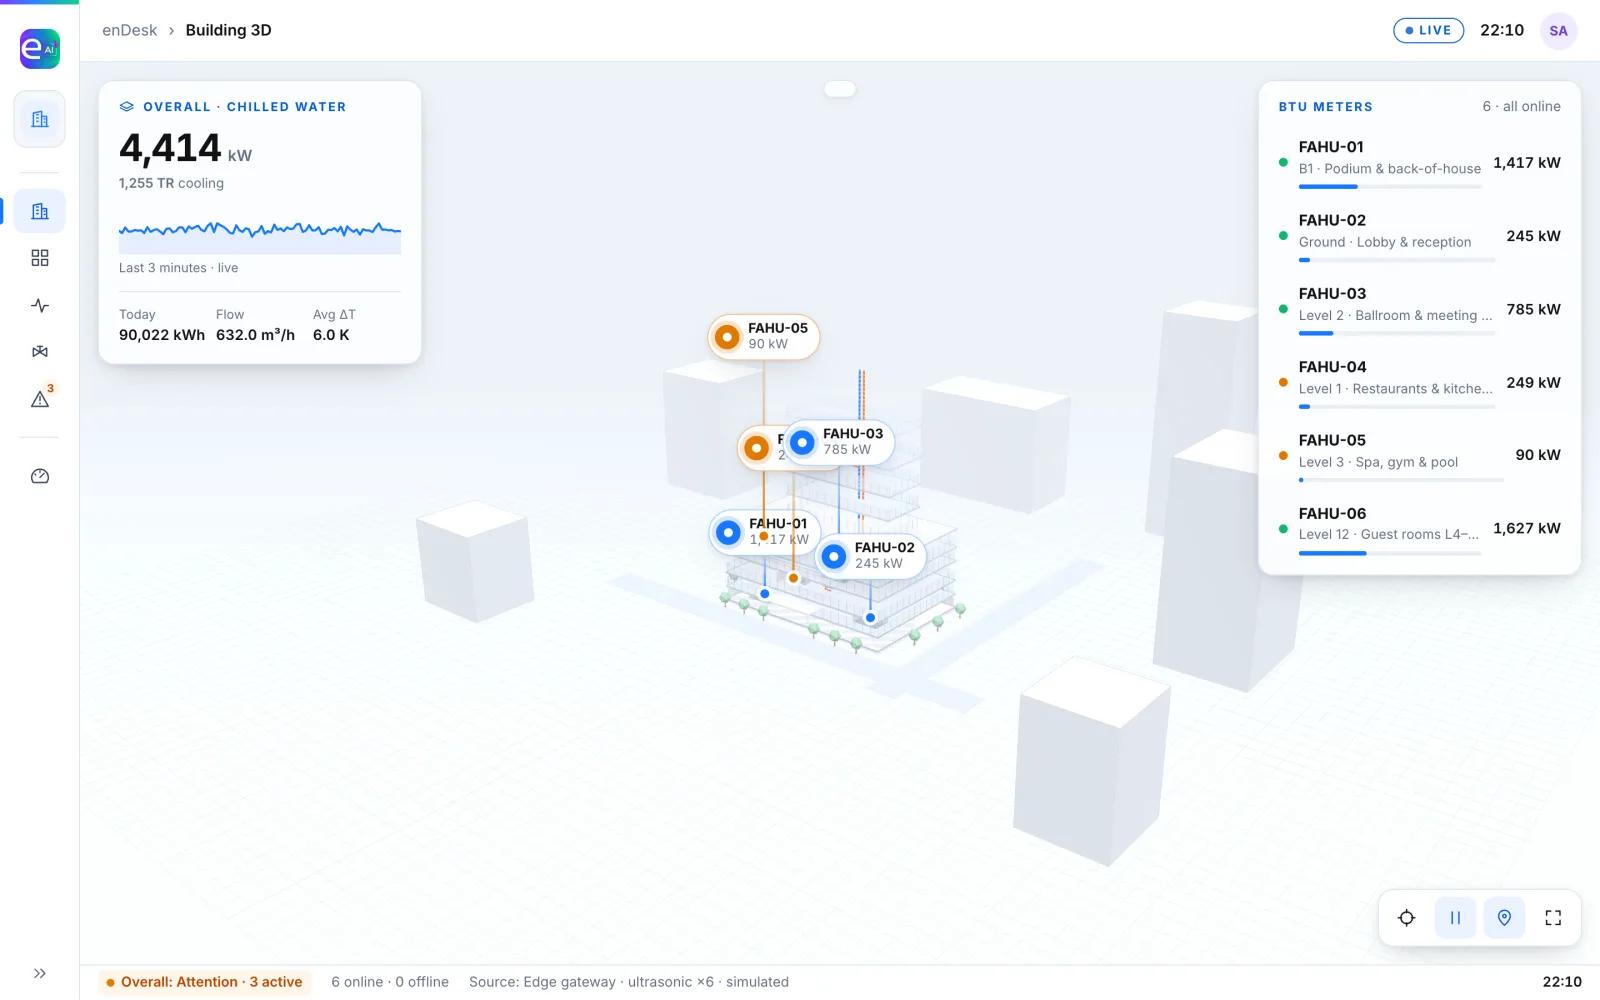
EnDesk, the desktop version of EnVista
EnDesk puts EnVista on a PC in the plant room or the control room, close to the meters. Building 3D, live readings, valve status and alarms in one window, with the same data and rules as EnVista in the browser.
Works with
Part of one platform
Next step
See EnVista on data like yours
Tell us about your buildings, meters and utilities. We'll walk you through it and come back with a proposal.